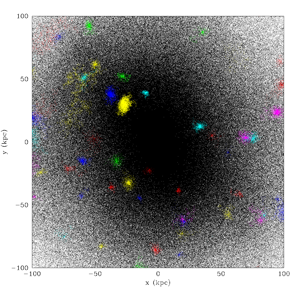
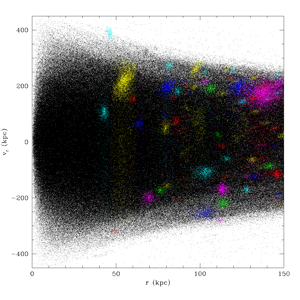
We are currently performing state-of-the art high-resolution dark matter simulations to constrain the low mass end of the mass function of dark halos, which are particularly relevant for dark matter detection experiments. We will further model the velocity distribution under conditions similar to our own Milky Way galaxy, with particular care taken to accurately simulate the tale of the velocity distribution, and validate their convergence with multiple simulations.
 |
 |
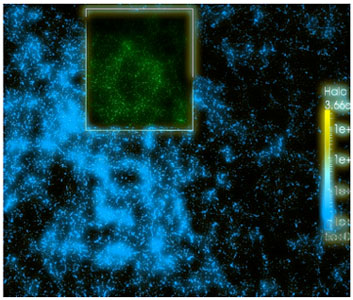
Dark Matter halos from a Roadrunner Universe Ly-a simulation (64 billion particles), showing 1/64 of the total 750 Mpc/h cubed volume. |
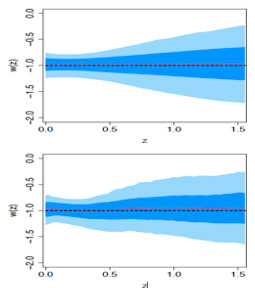
Dark energy EOS--consistent with^--form current supernova data reconstructed using Gaussian process-based MCMC. |
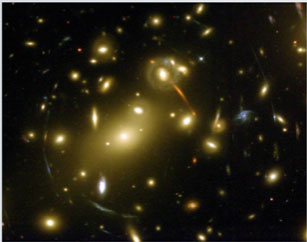
Abell 221.8 A supercluster of galaxies. The arcs are due to gravitational lensing. |
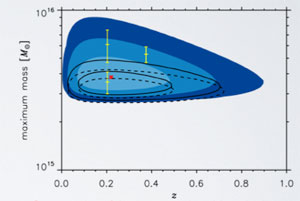
Contour plot of the most massive objects in the Universe. The most massive object in the entire Univrse is predicted to lie in the blue region. We predict the mass of the object, as well as the redshift (which is a measure of distance in cosmology). The red star represents the most likely values. The solid line contours are for the 2nd most massive halo, while the dashed line contours are the 3rd mmost massive halo. The yellow data points are the masses of the most massive observed superclusters of galaxies. |